Data Viz / UXUI
Donut Charts Exploration
Complex security data often requires multiple levels of context. This project explored donut and nested donut visualizations as a way to represent bot traffic distributions, relationships, and hierarchy within analytics dashboards. The work focused on component design, interaction behavior, and visual clarity to help users interpret large datasets more effectively.
Client F5
Role UX Design / Data Visualization / Component Design
Publication 2025 Bot Defense / F5 Distributed Cloud Services
Challenge
Problem
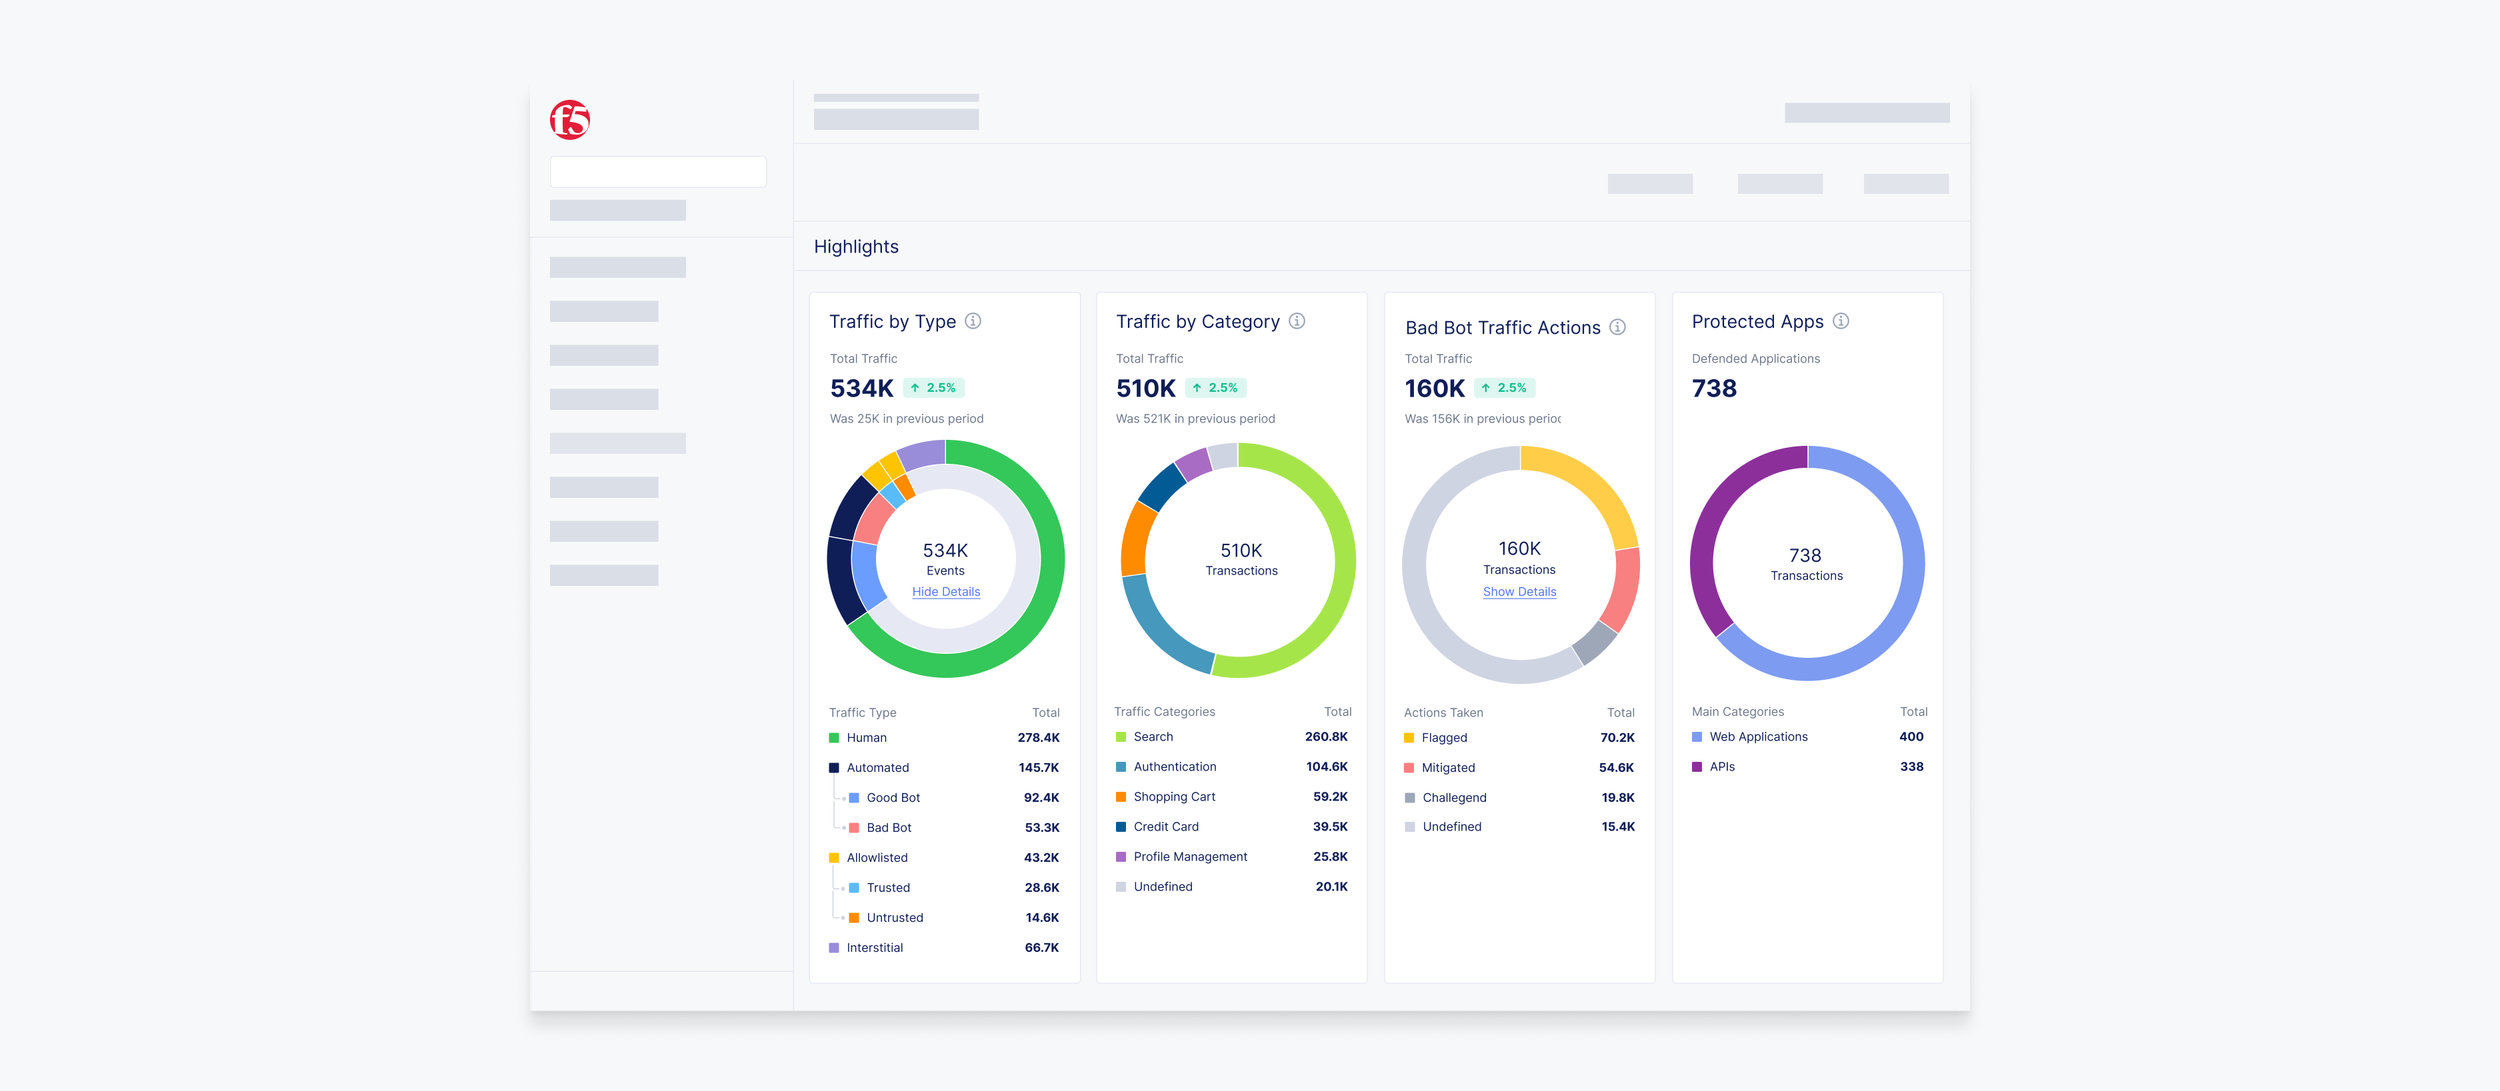
Complex security datasets often require multiple levels of context, but traditional donut charts flatten hierarchical relationships into a single view. This made it difficult to explore parent-child relationships without sacrificing readability or overwhelming users with information.
Solution
A progressive disclosure model was explored using nested donut charts, expandable hierarchy, and contextual legends. The component reveals additional levels of detail only when needed, allowing users to move from overview to investigation while maintaining context.
Exploration
Overview
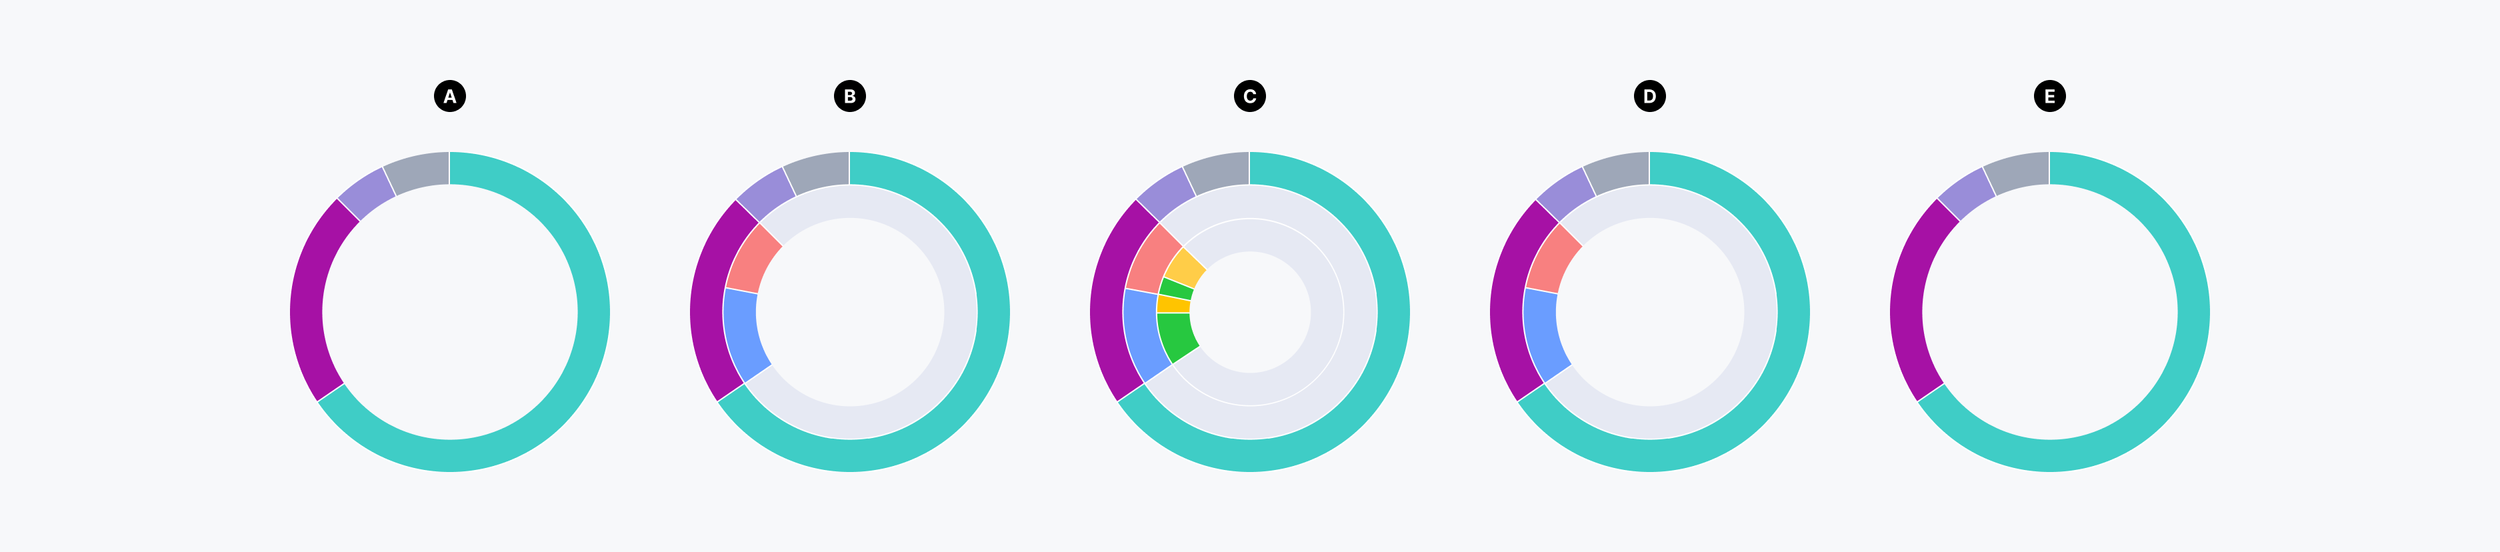
Multiple concepts explored hierarchy, legend organization, and interaction patterns for complex, nested data.
Hierarchy
Explored approaches for visualizing nested data while preserving context. Concepts focused on progressive disclosure, clear parent-child relationships, and maintaining orientation as users navigated deeper into the hierarchy.
A. Overview
Top-level categories.
B. First Expansion
Reveal second level.
C. Deep Hierarchy
Reveal third level.
D. Collapse State
Return one level.
E. Reset
Return to overview.
Legends
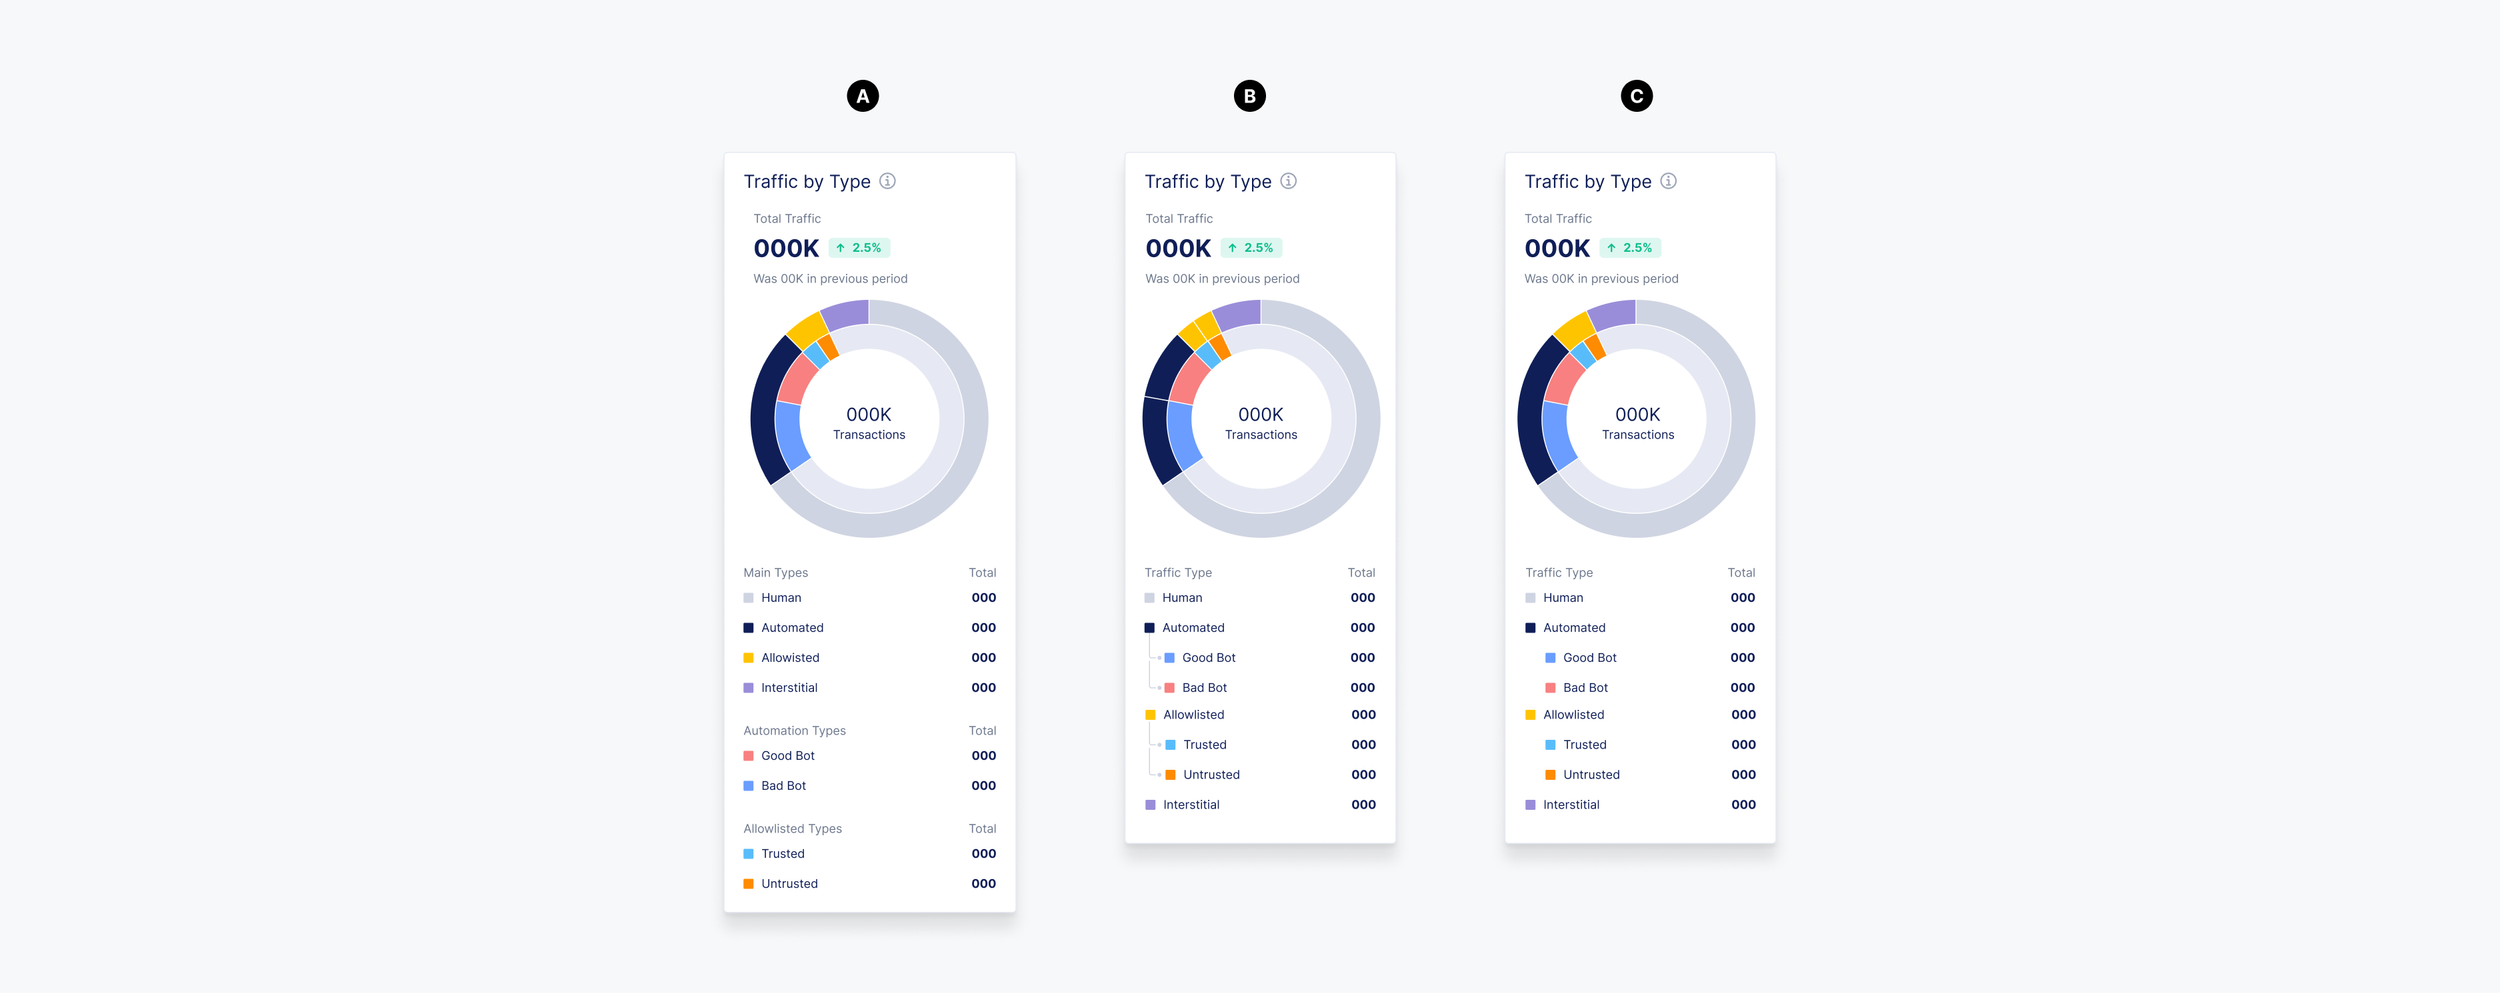
Explored legend structures for organizing nested data while balancing readability, hierarchy, and scanability.
A. Stacked Legend
Separate levels
Clear organization
Repeated labels
B. Tree Indentation
Parent-child grouping
Reduced repetition
Strong hierarchy
C. Simplified Indentation
Cleaner layout
Less visual noise
Faster scanning
Interaction Patterns
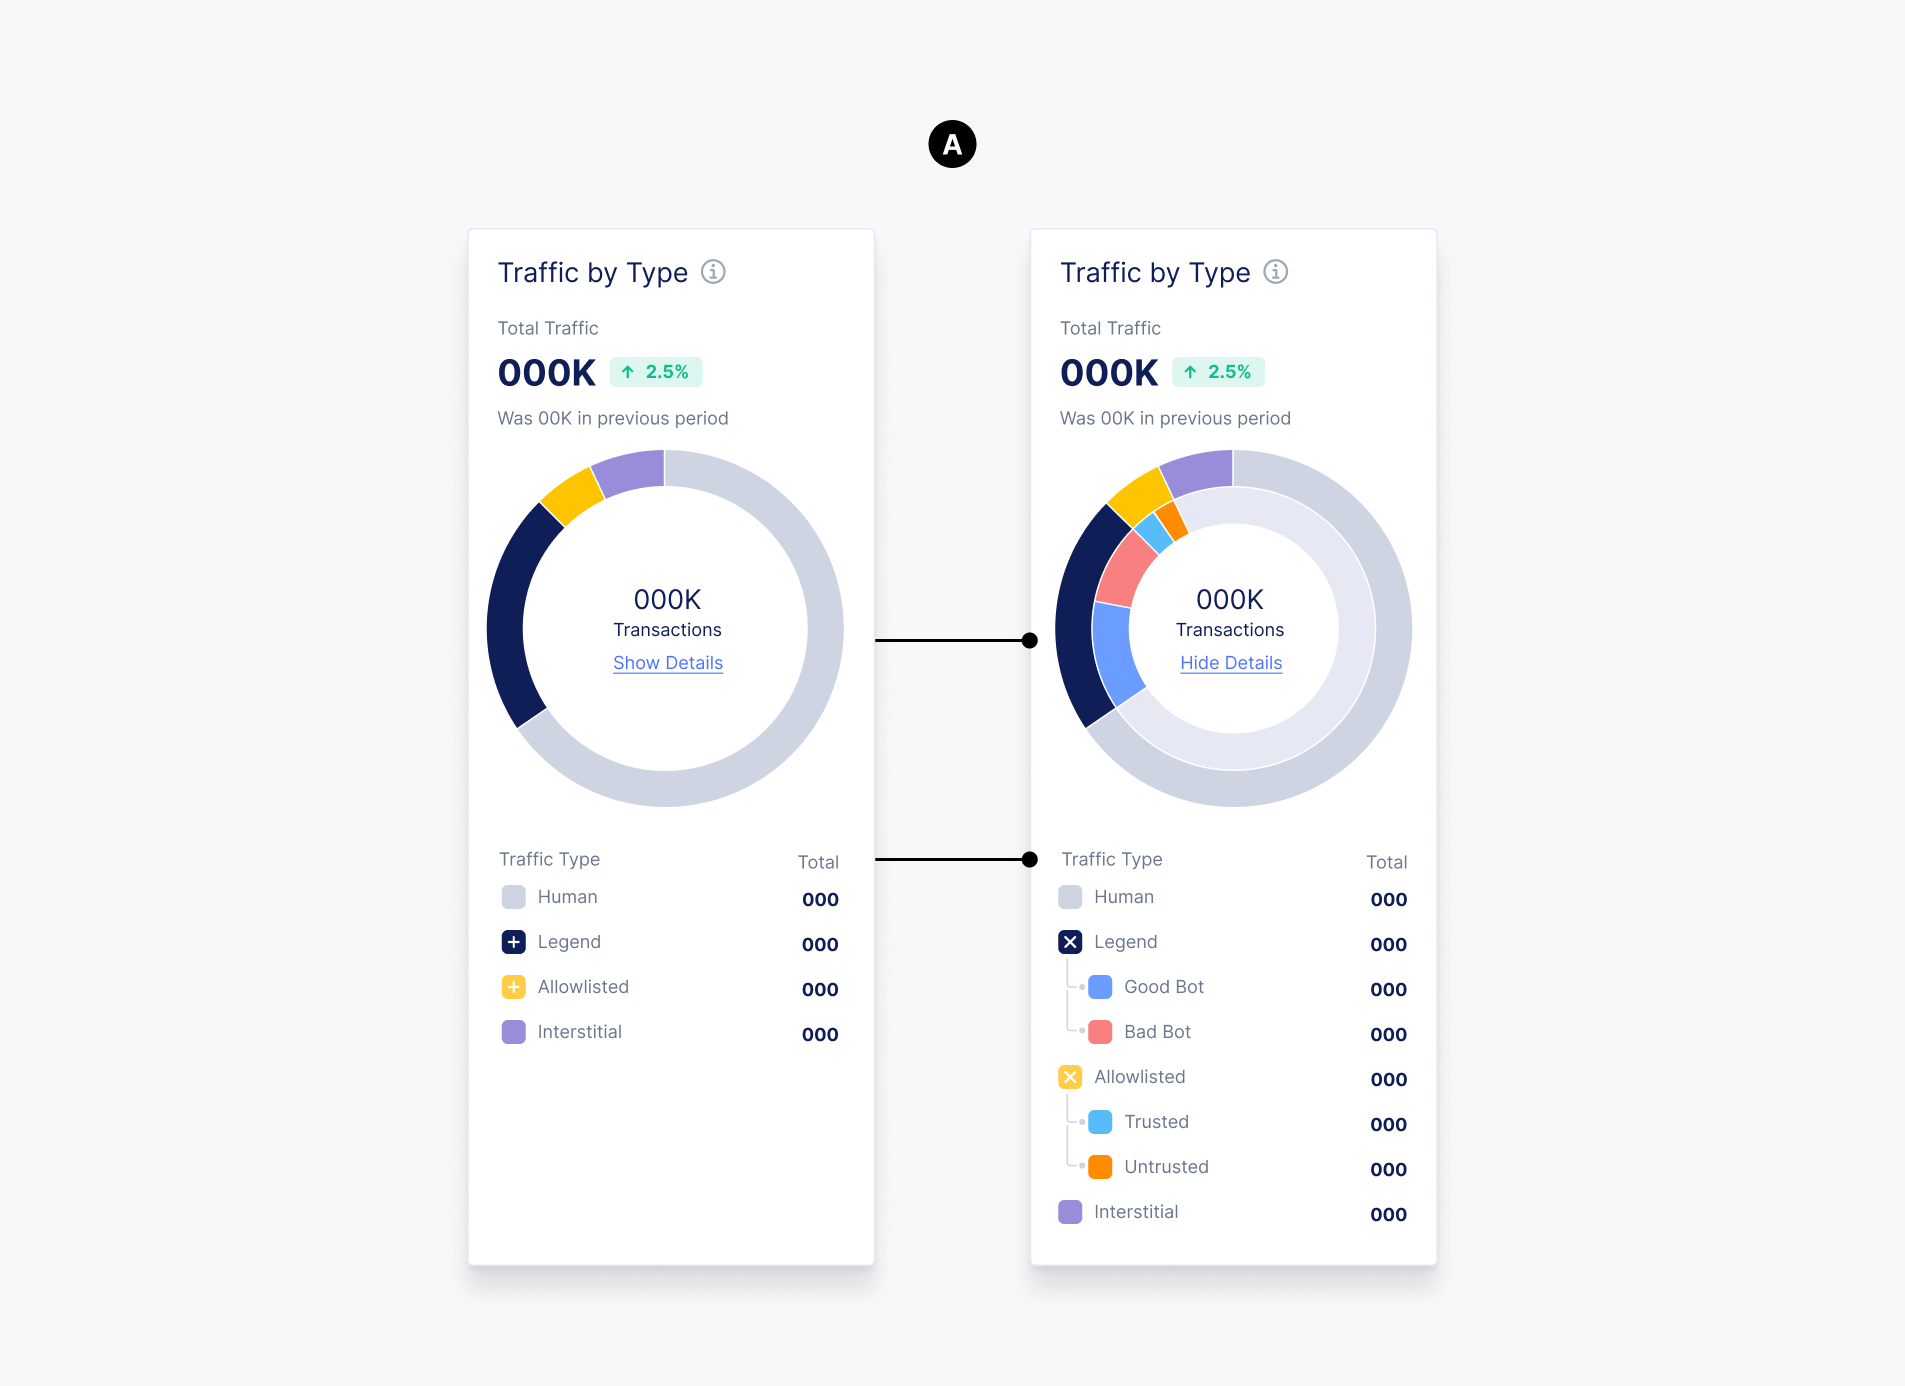
Explored interaction models for revealing nested data while balancing discoverability, flexibility, and interface simplicity.
A. Interactive Legend
Multiple entry points
Flexible exploration
Higher interaction density
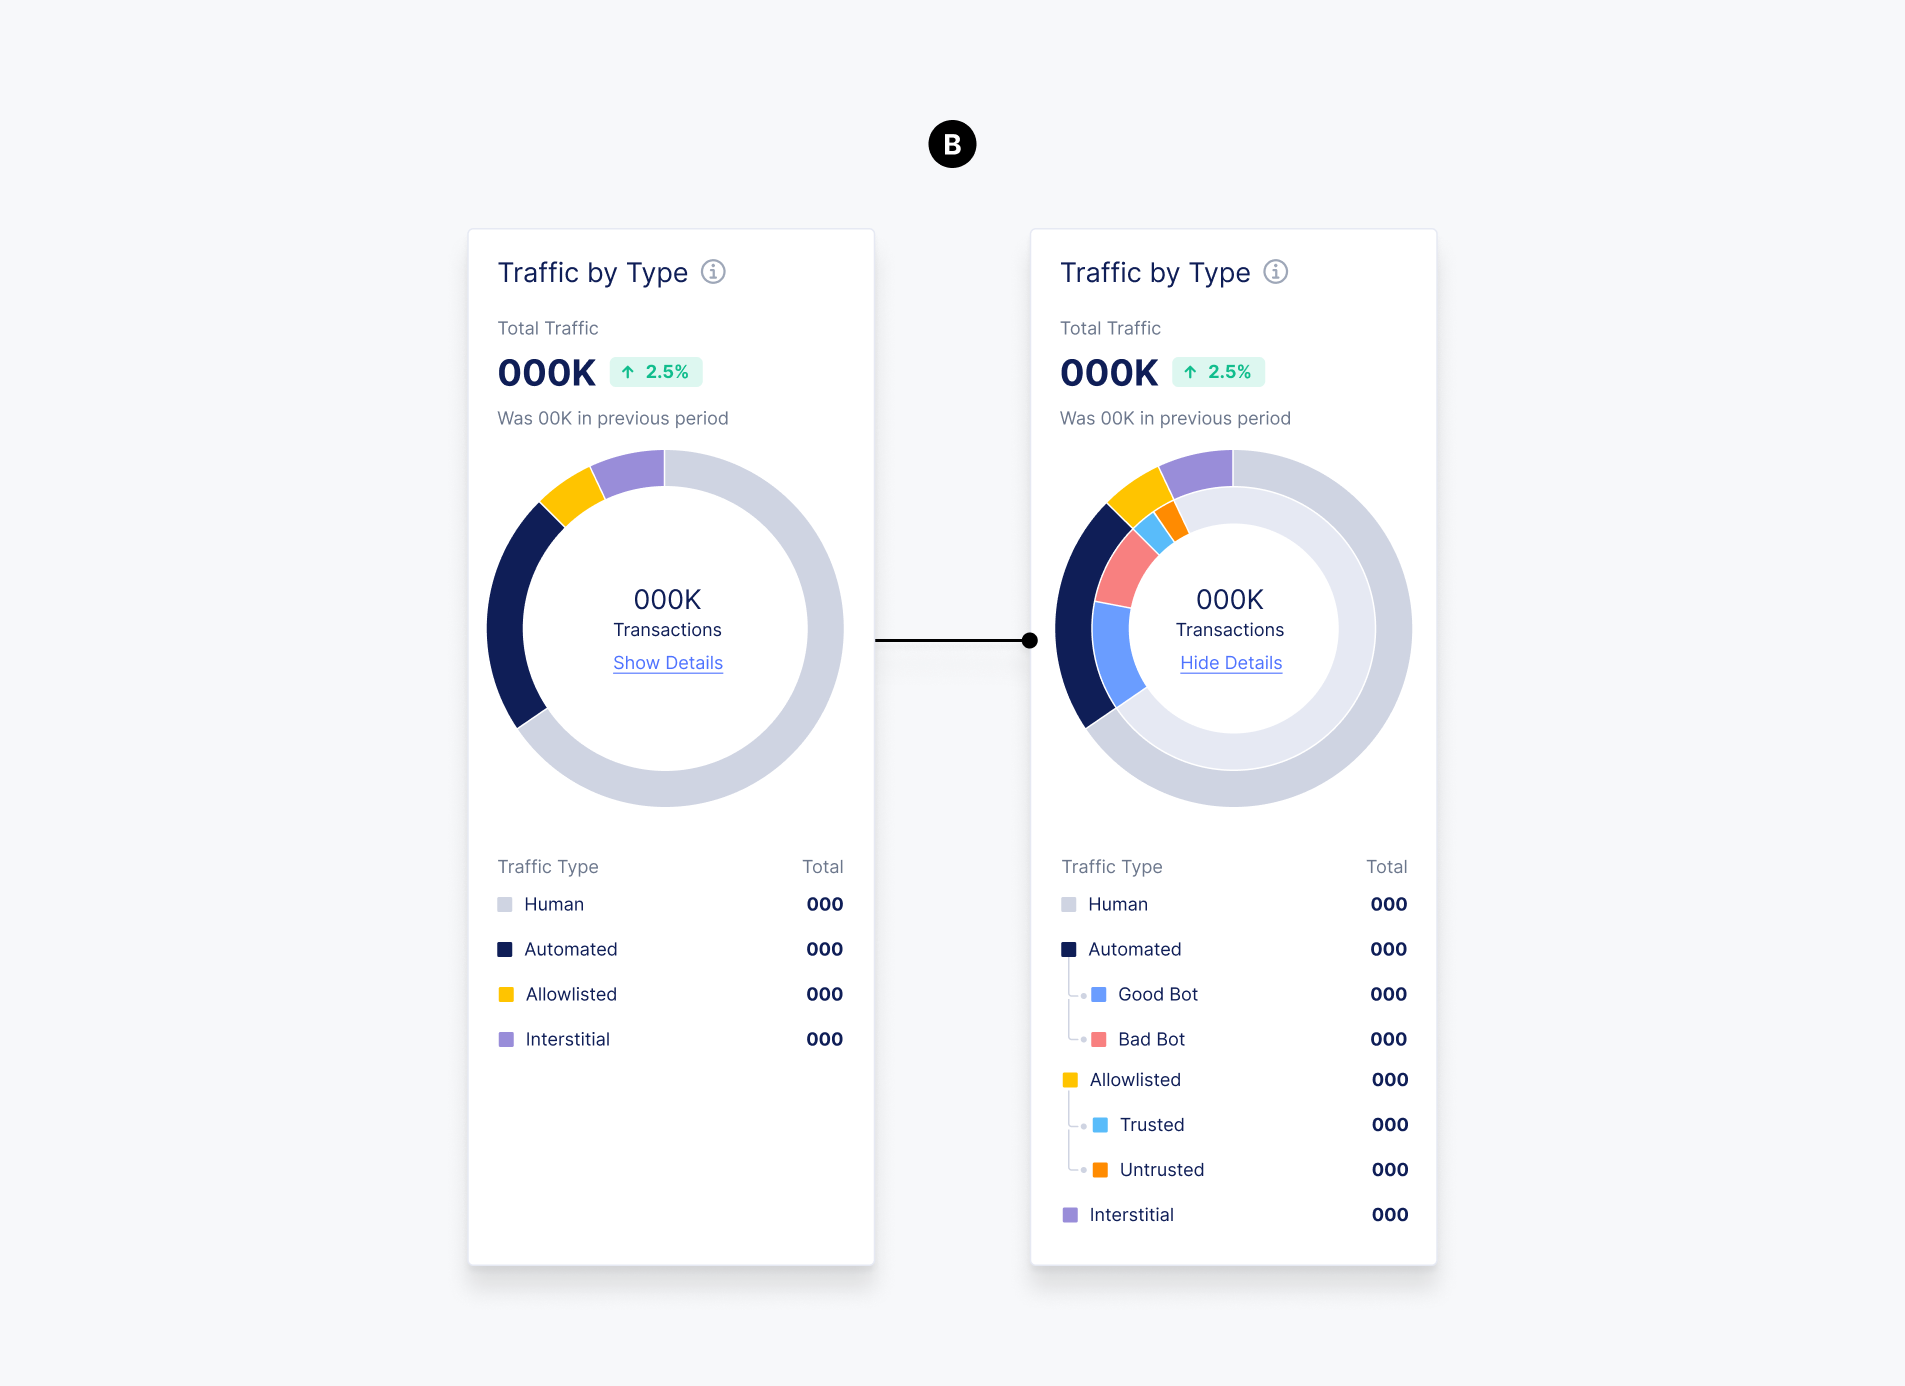
B. Non-Interactive Legend
Single entry point
Simpler behavior
Cleaner interface
Outcome
The exploration established a reusable component system for visualizing hierarchical data. The final concept balances readability, scalability, and progressive disclosure while preserving context across multiple levels.